A traceroute is a diagnostic tool that maps the journey of data packets from your computer to a specified destination across an IP network. It lists all the intermediary devices, known as “hops,” that the data traverses, along with the time taken for each hop. This information is valuable for identifying network issues and understanding where delays or failures occur.
There are moments when your website might be running slow. This slow response could signal a problem. Many people jump to the conclusion that the server is overloaded and contact tech support. Usually, the support team will ask for a ping and traceroute report. We provide instructions for generating these reports, but they can seem a bit tricky to interpret. However, it’s a smart approach for diagnosing issues with Time4VPS or other private hosting options.
How a Traceroute Works?
When your computer connects to a website, it takes a journey through various points, similar to connecting dots. It all kicks off at your local router, then travels to your ISP, and moves onto the larger networks. There are several junctions along the way before it finally exits the Internet highway to reach the website’s local network and the web server itself.
Using a traceroute, you can visualize the path your signal took to get to the website. It also shows the response times at each stop. If you’re experiencing connection issues or delays, these times will reveal where the problem lies. You can easily identify which ‘hop’ along the route is the troublemaker.
Understanding Traceroute Output
When you run a traceroute, it creates a report while it travels along the route. Check out this sample traceroute below:
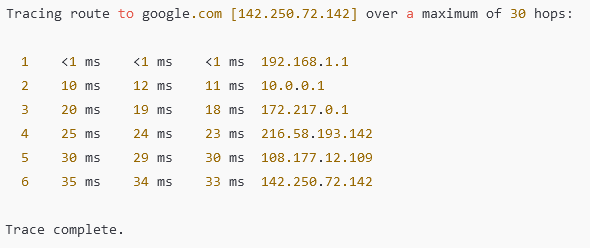
So, if you look closely, you’ll notice the report is laid out in several rows and columns. Each row indicates a “hop” along the route, acting like a pit stop for the signal to get its next directions. Each of these rows has five columns.
When you run a traceroute, the output typically includes several columns:
- Hop Number: Indicates the sequence of routers the packet passes through.
- Round-Trip Times (RTT): Usually, three time measurements in milliseconds (ms) show how long it takes for a packet to travel to that hop and back.
- Router Address: Displays the IP address or hostname of the router at each hop.
In the provided example, you can see that latency goes up a bit with each hop, which is totally expected since packets are covering more ground. There are no timeouts or delays over 100 ms, so that means the connection is running smoothly. Overall, it shows that communication with Google’s server is working perfectly.
What to Do if You Encounter Issues:
Timeouts:
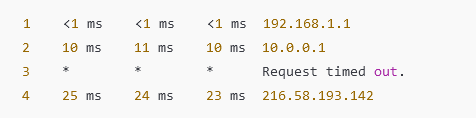
The * * * shows that the packet didn’t get a reply from the router at Hop 3. This might happen because a router firewall is blocking ICMP packets or it could just be a temporary glitch. It’s not a big deal unless it keeps happening.
Timeouts at the Beginning of the Report
If you notice timeouts right at the start of the report, like in the first couple of hops, but everything else goes through fine, don’t stress about it. That’s totally normal since the device in question probably just doesn’t reply to traceroute requests.
Timeouts at the Very End of the Report
Timeouts at the end can happen for various reasons, and not all of them mean there’s a problem.
For instance, the target’s firewall might be blocking requests, but you can likely still reach it with a regular HTTP request. This shouldn’t mess with your normal connection.
There could also be an issue with the return path from the destination. This means the signal is getting through, but the response isn’t making it back to your computer. Again, this shouldn’t impact your regular connection. However, if there’s a connection problem at the target, that will definitely affect things.
High Latency:
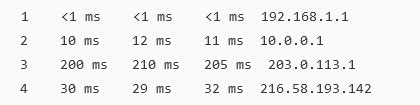
Hop 3 is showing a pretty high latency of 200 ms, which could mean there’s some network congestion or a problem at that point.
When to Use Tracert:
- Slow Website Diagnosis: If a site is taking its sweet time to load, tracert can help you figure out where the hold-up is happening.
- Network Issues: If you’re having trouble connecting, tracert can show you where the connection is getting stuck or slowing down.
- Support from ISP or Hosting: If you notice a particular hop with high latency or frequent timeouts, you can pass those results along to your ISP or hosting service for more help.
When you notice a hop that seems off, you can track down its location and see what’s going wrong. The issue might be in your network, with your ISP, along the way, or in your hosting provider’s territory.
The first hop is your network, the second is your ISP, and the last few are likely managed by your hosting provider. If the problem is there, they could help you out. If it’s earlier in the route, then it’s just a matter of something along the way that neither you nor your hosting provider can control.